


.webp)


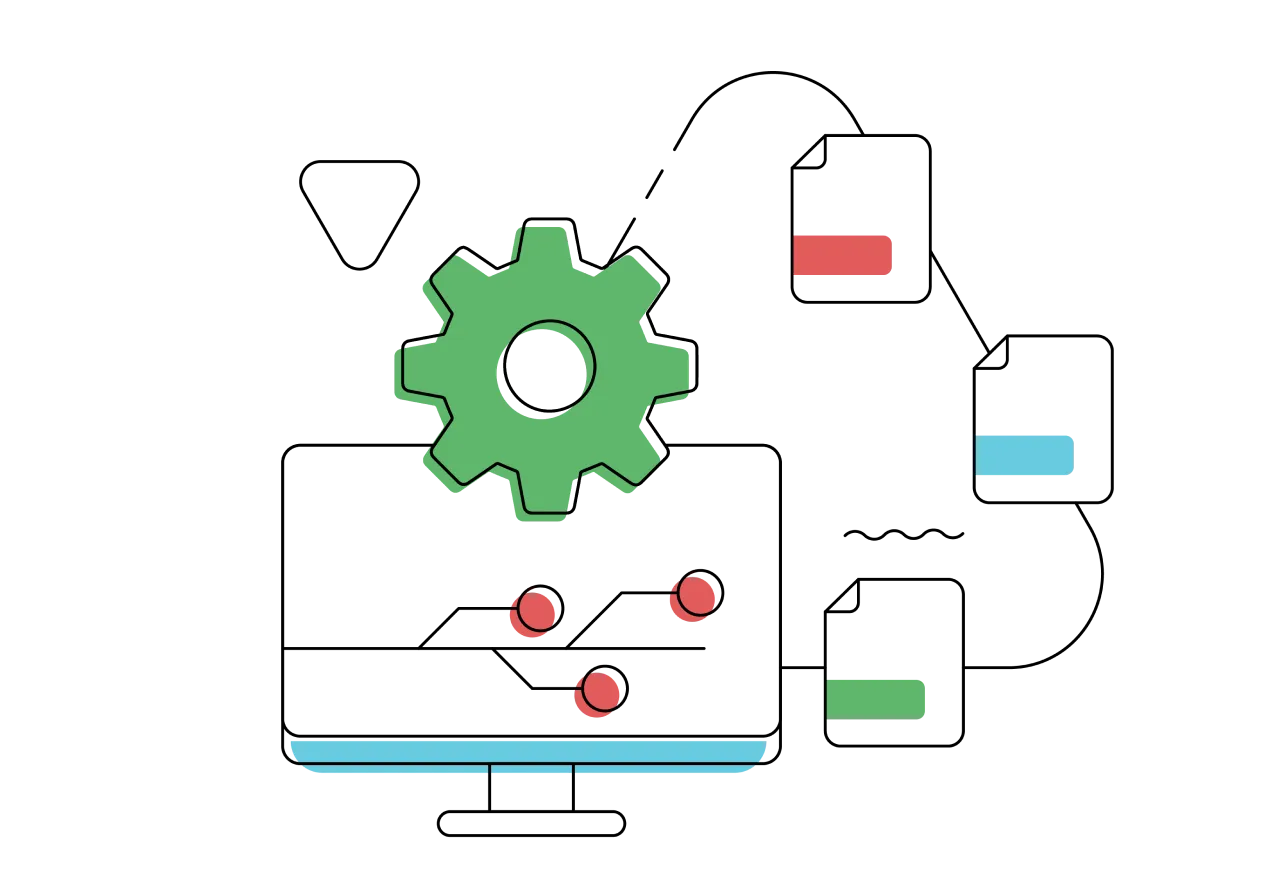
Collaborate seamlessly with other departments, agencies and printers
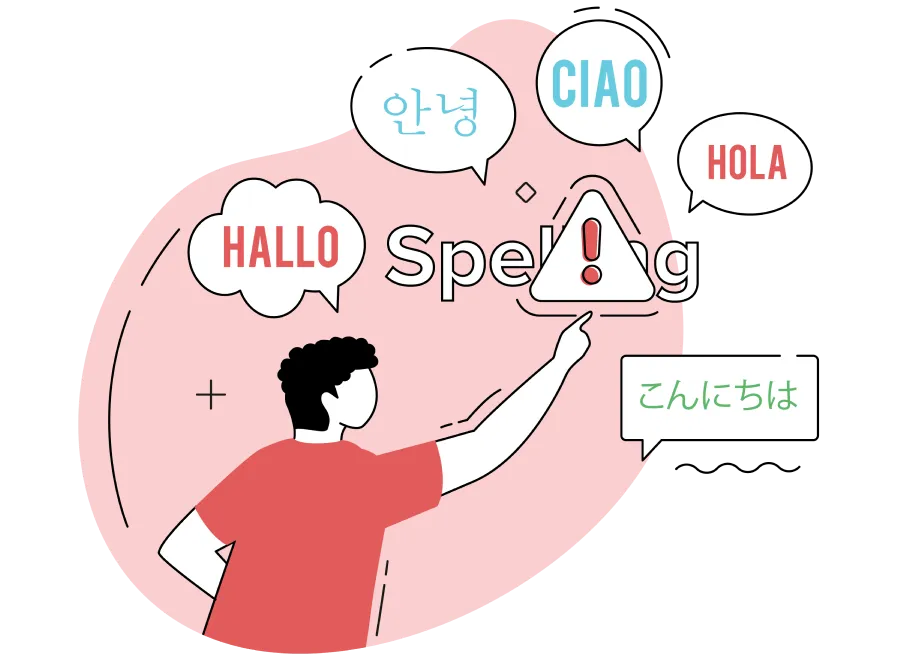
Minimize Errors
Get everyone on the same page by streamlining the artwork approval process. Manage pack copy, leverage AI-powered proofing tools for artwork review and manage artwork revisions within the DAM to minimize errors and enhance accuracy.Stay Compliant
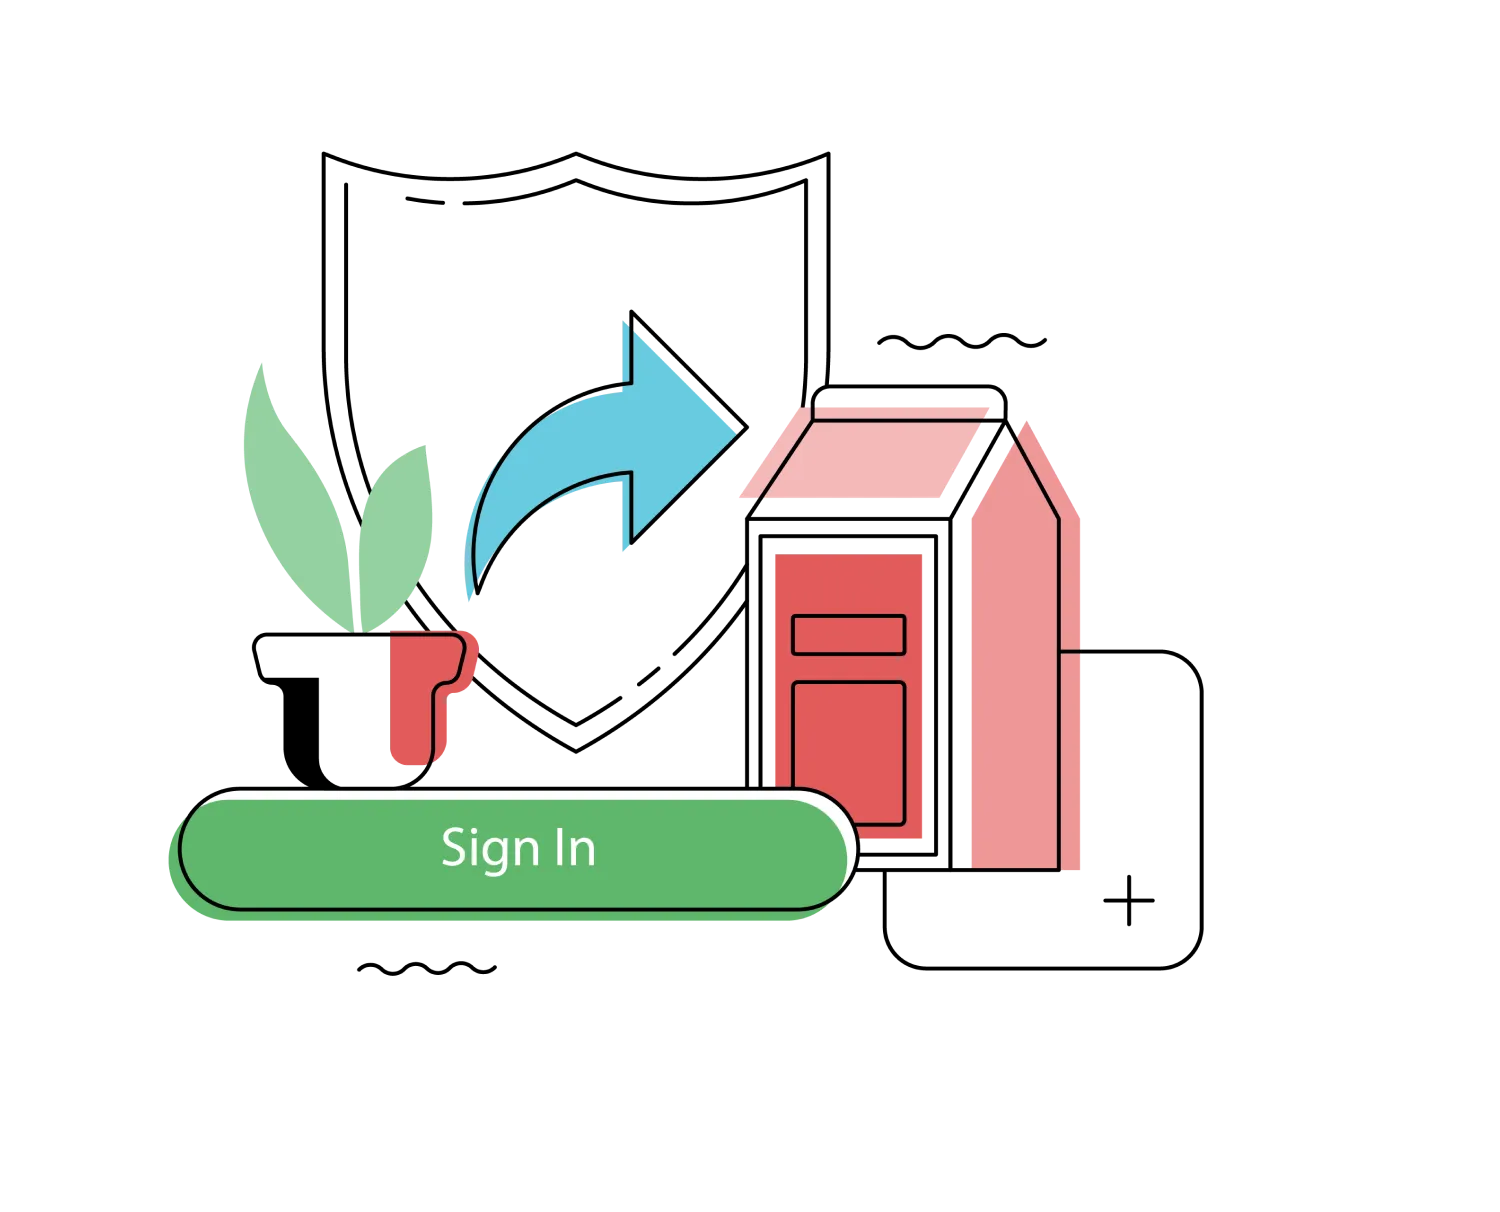
Ensure regulatory compliance and maintain brand consistency across all products and markets to reduce the risk of recallsLaunch Faster
Streamline your workflows for maximum efficiency, reduce the number of iterations, and expedite the launch of your products


%201.webp)


.webp)