This is some text inside of a div block.
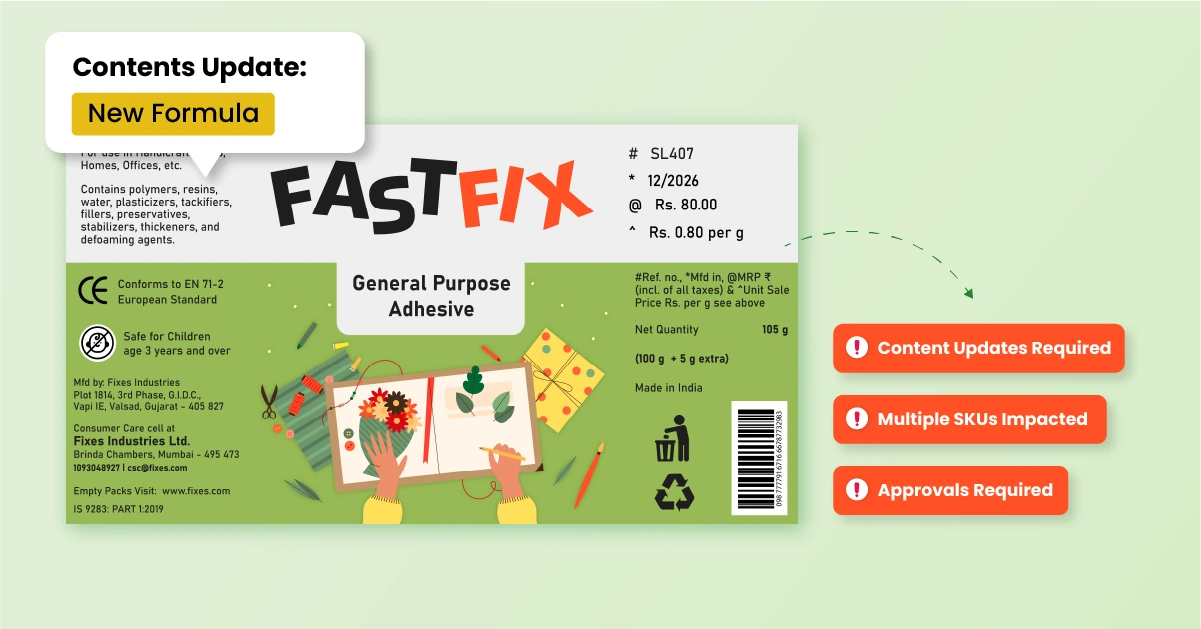
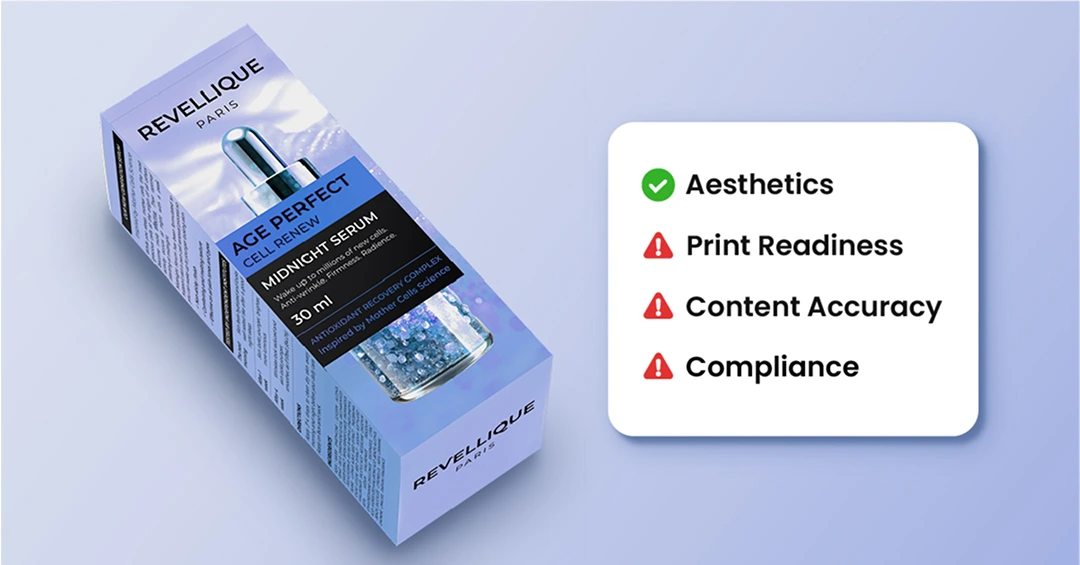
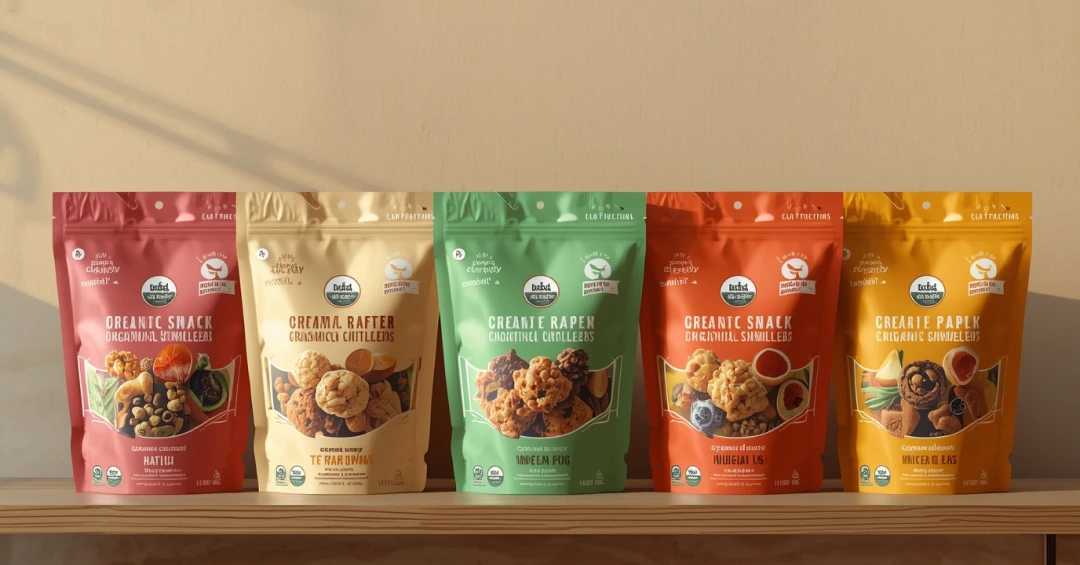
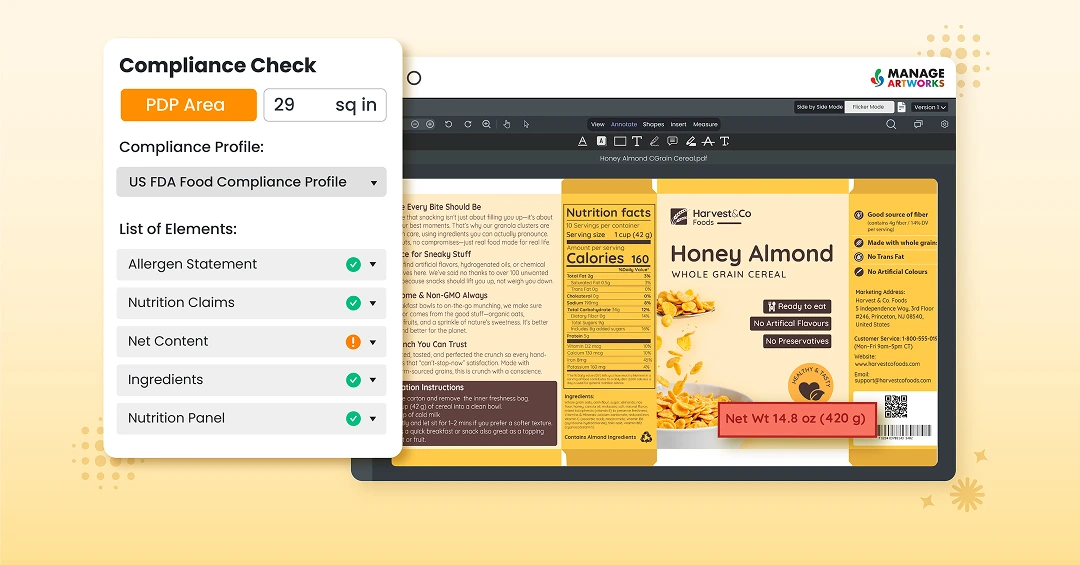
How to Prepare Packaging Workflows for Holiday Artwork Pressure
Learn how to prepare packaging workflows for holiday artwork pressure by managing seasonal variants, approvals, and compliance efficiently. Discover how upfront planning and artwork management systems help teams deliver festive packaging without delays or errors.